
Your Markets.
Your Workspace.
Market monitoring with the control to make it yours.Bring instruments, quote data, visual activity, linked charts, and advanced alerts into one configurable workspace.
Availability depends on your connected data feed.
A different layout for every purpose.
Conditions, rearming, sounds, and visual status.
Build the board you’ve always wanted.
Choose what you follow, what you see, and how each board fits your workspace. Build a compact contract board, a broad market overview, or several independent watchlists with their own layouts.
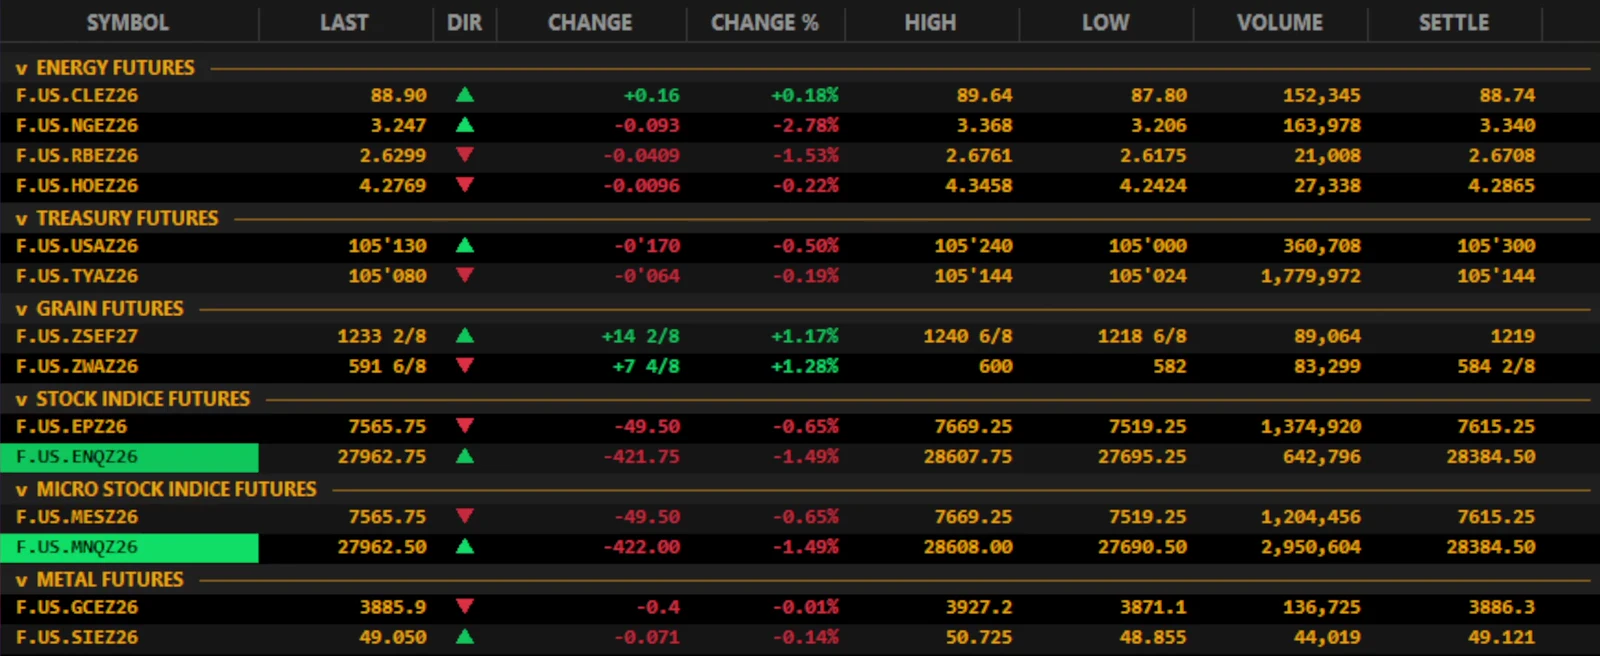
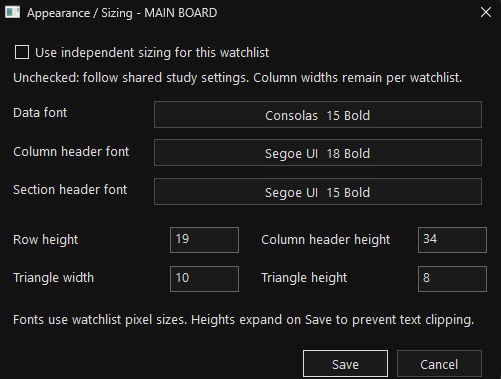
Give one board compact rows and another larger text. Column widths stay individual to each board.
Every board, independently.
- Arrange boards and adjust their dimensions to suit your screen.
- Choose data, column-header, and section-header fonts.
- Set row heights and column-header height.
- Adjust direction-indicator width and height.
- Use independent sizing or follow your shared settings.
Every column, deliberately.
- Choose from 300+ fields, subject to data availability.
- Arrange columns in the order you prefer.
- Fit one column or all visible columns to content.
- Align values left, center, or right.
- Set header and data text colors by column.
- Apply conditional formatting to highlight what matters.
Set the condition. See the status.
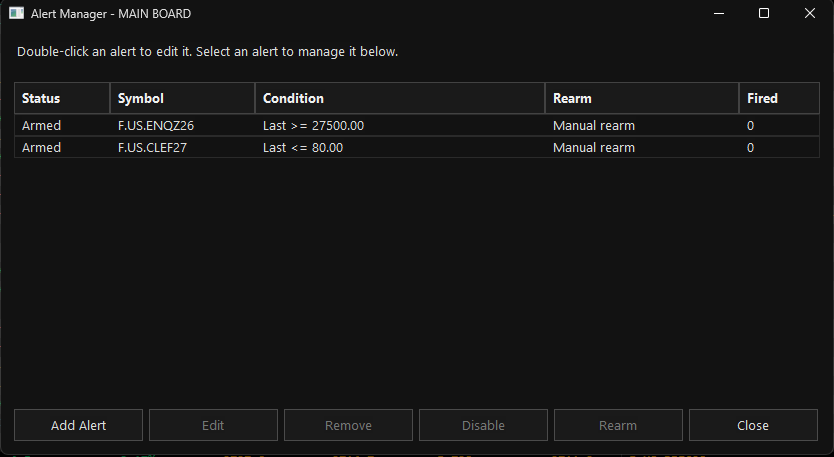
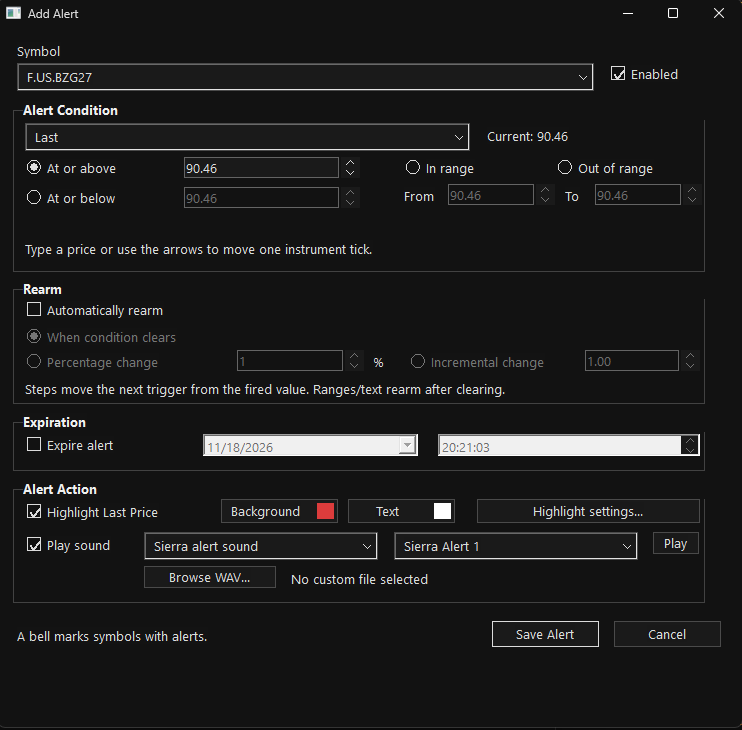
Choose the condition you want to monitor, decide how it should rearm, and control how you’re notified. A bell beside the instrument marks symbols with alerts.

- Price thresholds and ranges
At or above, at or below, inside a range, or outside a range. - Automatic rearming
Rearm when conditions clear, or use percentage and incremental change settings where applicable. - Date and time expiration
Choose when an alert should expire. - Visual and sound notifications
Customize last-price background and text highlights. Choose a built-in sound or your own WAV file. - Manage alerts in one place
Edit, disable, remove, or rearm alerts from Alert Manager.
See the alert setup controls
Find the instrument.
Choose the information.
Build lists around the markets you follow and put the quote fields you use directly on your board.
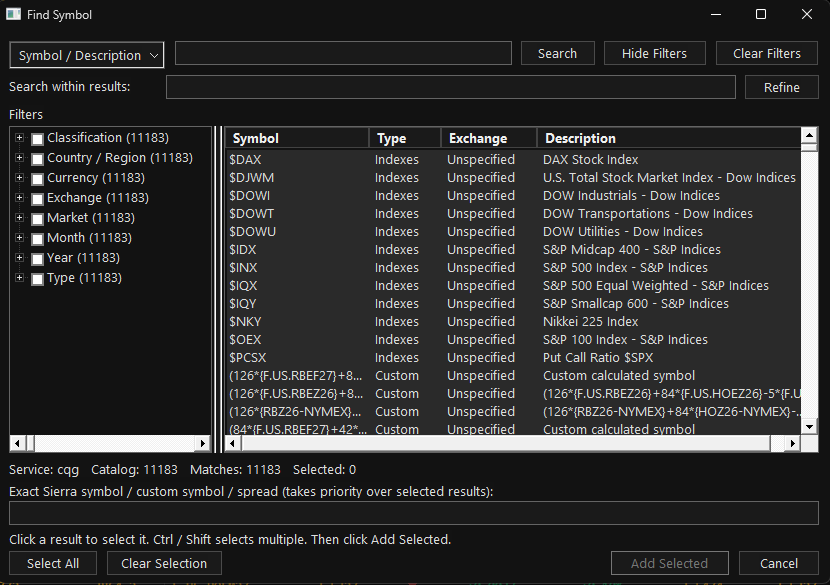
Find symbols and build lists.
Search by symbol or description, then refine within the results. Filter by classification, region, currency, exchange, market, month, year, or instrument type.
Select multiple instruments to add together, or enter an exact custom symbol or spread supported by your platform and data service.
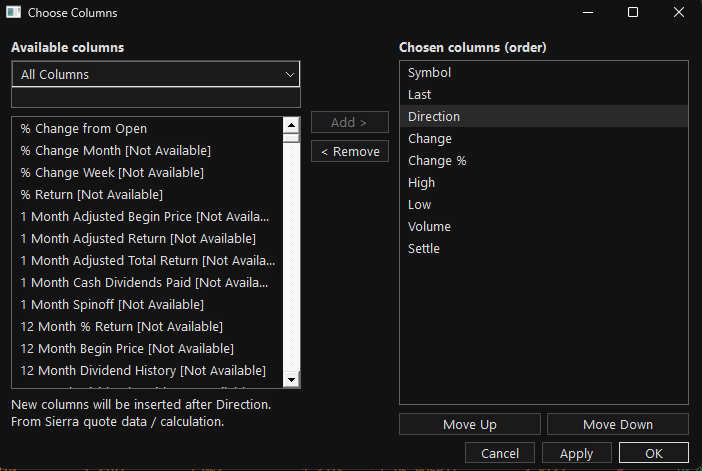
300+ columns to choose from.
Build a focused quote view with Last, Direction, Change, High, Low, Volume, and Settle, or add fields such as Bid, Ask, Spread, and other available data.
Add and remove columns, change their order, restore hidden fields, and save the layout you want to use again.
Available instruments and populated quote fields depend on your platform, connected data feed, and subscriptions. Fields marked “Not Available” in the example are unavailable through that connection.
Built for the way you work.
Organize your markets.
Group instruments under section headers, collapse sections, drag rows into order, and lock rows and columns when your layout is set.
Keep the order you need.
Sort a column ascending or descending, keep it sorted automatically, or restore your manual row order.
Connect quotes and charts.
Select an instrument to switch a linked chart to that symbol and move from monitoring to a closer look.
Take your data with you.
Import and export symbols and section headers. Copy the quote table or export it as a tab-separated file for use in a spreadsheet.
Make it readable.
Use instrument-specific price formats, including Treasury fractions and grain eighths. Choose dark or light themes and customize colors and visual tick activity.
Keep controls close.
Use keyboard shortcuts, cut/copy/paste symbols, and keep a board always on top. Save column layouts and reuse defaults for new watchlists.
More control for everyday board management
Add and delete rows, edit section names in place, work with selected rows, and restore hidden columns. Futures users can manually roll contracts forward or backward or select a contract from the rolling controls.
Standard Watchlist vs. FPTG Watchlist
Standard Watchlist
The familiar starting point—a list of symbols with quotes to monitor.
FPTG Watchlist
A configurable workspace combining independent boards, 300+ selectable columns, visual tick activity, chart linking, saved layouts, and managed alerts.
This compares a basic quote-list workflow with the combined FPTG toolset. Individual platform and product capabilities vary.
Make the workspace yours.
FPTG Watchlist · For Traders, By Traders.
Coming Soon